Skip to content
Africa Fresh Fruits Company Ltd.mayirajeannepomuscene@gmail.com
Africa Fresh FruitsCompany Ltd · Rwanda
Request a Demo

Compare

From Manual Field Operations to Precision Agriculture.

Comparison matrix

Six dimensions, honestly compared

01

Soil compaction and root integrity

Bulk densityControlled trafficRoot-zone porosity
Request a consultation →

Traditional

Heavy tractors and boom sprayers concentrate load on wheel tracks. Repeated passes, especially on wet soil, compact the root zone and reduce infiltration.

Drone-enabled

Aerial application and scouting remove wheel traffic for those specific tasks. Tillage, harvest and haulage still involve ground equipment.

Benefits

  • + Fewer wheel passes for spraying and scouting
  • + Access when soil is too wet for machinery

Limitations

  • − Does not replace all field machinery
  • − Payload limits mean more refills on large fields

02

Speed and coverage

Ground sampling distance (GSD)Front/side overlapOrthomosaic
Request a consultation →

Traditional

Walking scouts sample a field in transects. Coverage is partial and depends on terrain and staff availability.

Drone-enabled

A mapping flight images the whole field. Total turnaround = flight time + image processing + agronomist review + reporting.

Benefits

  • + Whole-field coverage
  • + Repeatable flight paths for comparison

Limitations

  • − Processing and review time are real
  • − Battery swaps and weather windows constrain schedules

03

Precision application

Variable-rate application (VRA)Droplet spectrumSwath width
Request a consultation →

Traditional

Blanket spraying applies one rate across the whole field regardless of need.

Drone-enabled

Prescription maps allow spot or variable-rate application — only effective with correct nozzle calibration, droplet size, wind conditions, approved products and local regulation.

Benefits

  • + Targeted use of inputs
  • + Lower operator contact

Limitations

  • − Drift risk if wind and droplet size are wrong
  • − Only products approved for aerial use

04

Multispectral monitoring

NDVINDRERadiometric calibration
Request a consultation →

Traditional

Visual inspection detects stress once it becomes visible.

Drone-enabled

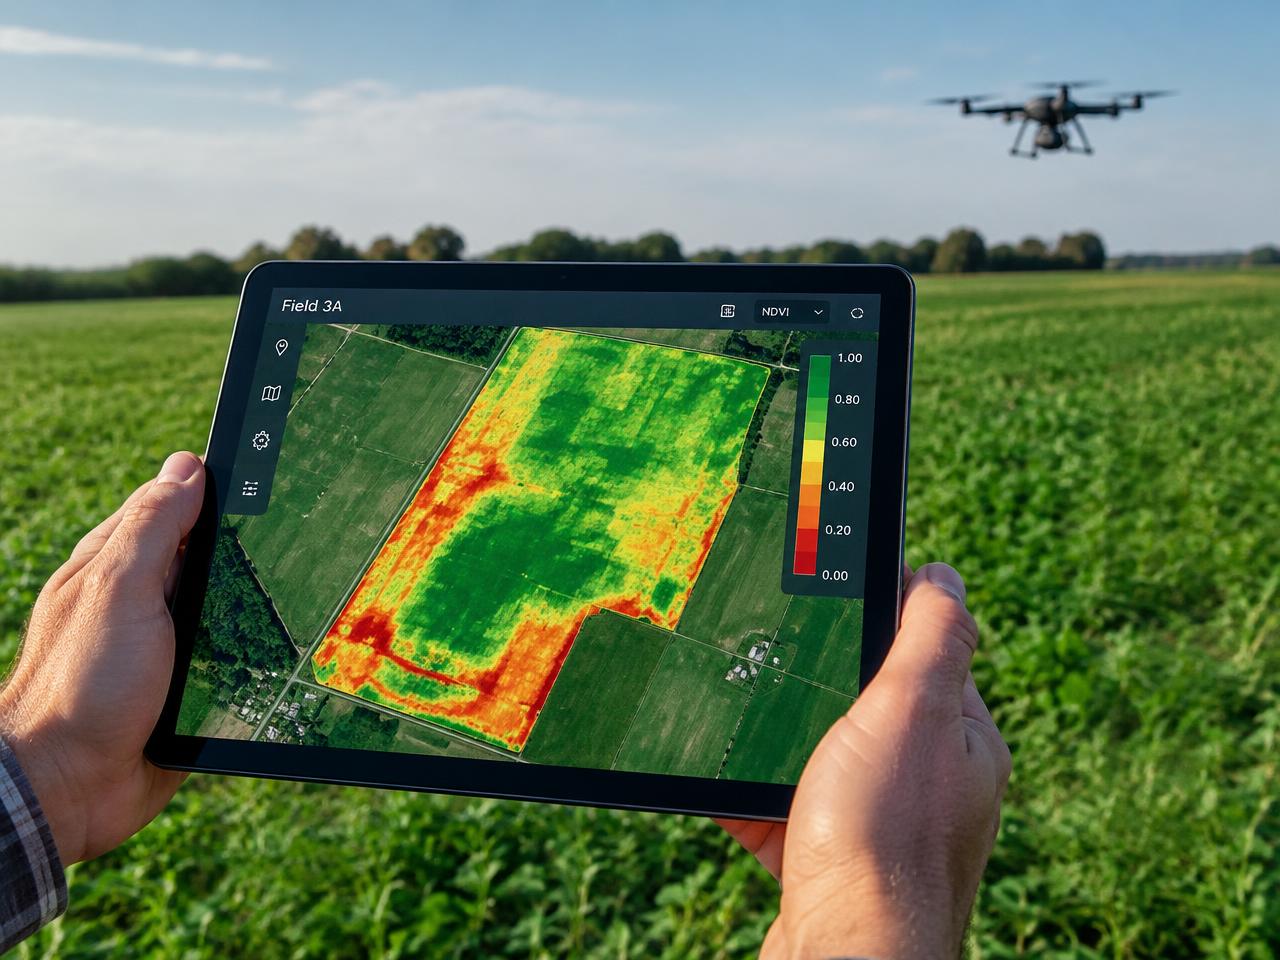
NDVI compares near-infrared and red reflectance; thermal imagery shows canopy temperature differences. These flag anomalies — they do not diagnose cause.

Benefits

  • + Earlier anomaly detection
  • + Objective, comparable maps over time

Limitations

  • − Requires field verification
  • − Affected by light, cloud and sensor calibration

05

Terrain and operator safety

VLOSGeofencingRTK positioning
Request a consultation →

Traditional

Steep terraces, mud and flooded plots slow or block access; backpack spraying exposes workers.

Drone-enabled

Pilots operate from a safe position over steep or wet terrain — within wind, rain, line-of-sight and airspace restrictions and with trained, certified operators.

Benefits

  • + Access to difficult plots
  • + Reduced chemical exposure

Limitations

  • − Weather-limited
  • − Requires permits and trained pilots

06

Operational cost and environment

Cost per hectareTotal cost of ownershipBreak-even
Request a consultation →

Traditional

Costs are dominated by labor, fuel, equipment depreciation and blanket input use.

Drone-enabled

Costs shift to service fees or equipment, batteries, maintenance and training. Savings depend on how much input use can safely be reduced.

Benefits

  • + Potential input and fuel savings
  • + Lower labor intensity

Limitations

  • − Upfront and maintenance costs
  • − Savings are not guaranteed

ROI calculator

Estimate with your own numbers

Every assumption is editable. We don't pre-fill reduction rates or promise a positive result.

Estimate · illustrative

Enter the following to calculate an estimate:

  • cultivated acreage
  • annual input expenditure
  • application cycles per year
  • drone service cost per acre
  • estimated input reduction (0–100%)
Formulas
savings      = annual_spend × reduction%
drone_cost   = acres × cycles × cost_per_acre
labor_saved  = hours_per_cycle × cycles
net          = savings − drone_cost
break_even % = drone_cost ÷ annual_spend × 100

This is not a quote or a guarantee. Results depend entirely on your assumptions, crop, products used, weather and local regulation.

Request a consultation

Technical guide

Precision agriculture technical guide

A practical overview of drone-based scouting, multispectral indices and targeted application for East African farming systems.

The guide is being prepared. Request access and we'll email it when it's published.

We use your details only to send the guide and related follow-up. See our Privacy Policy.